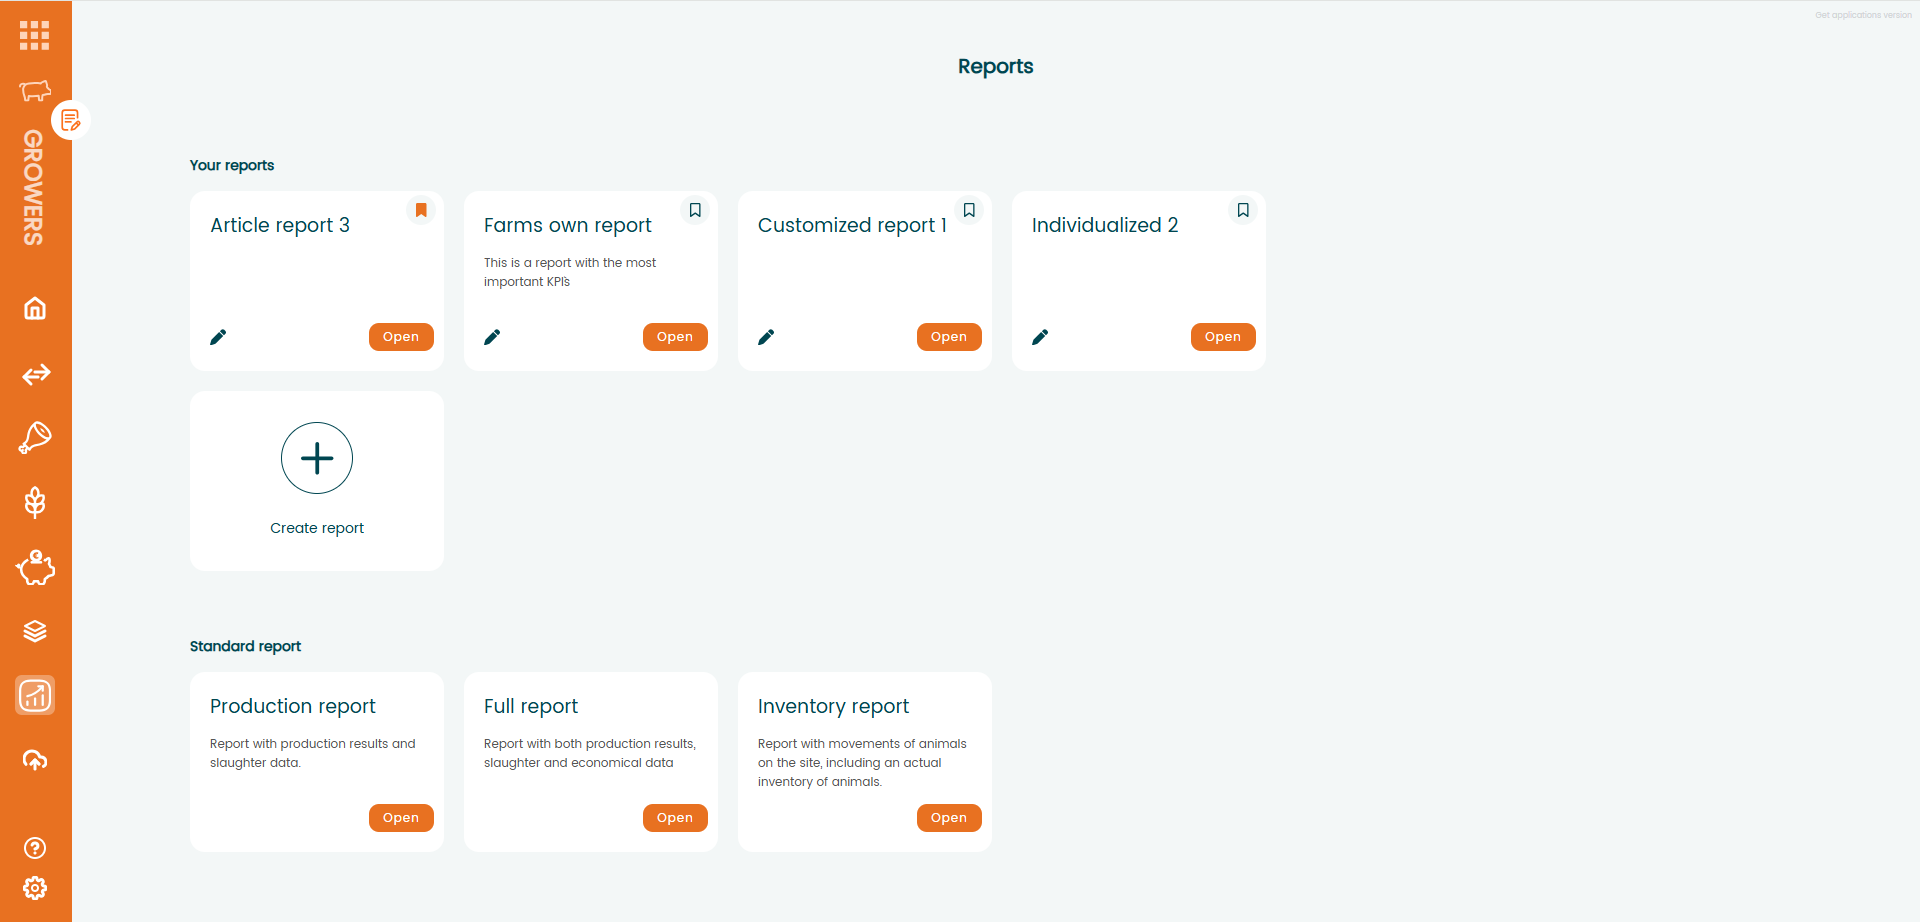
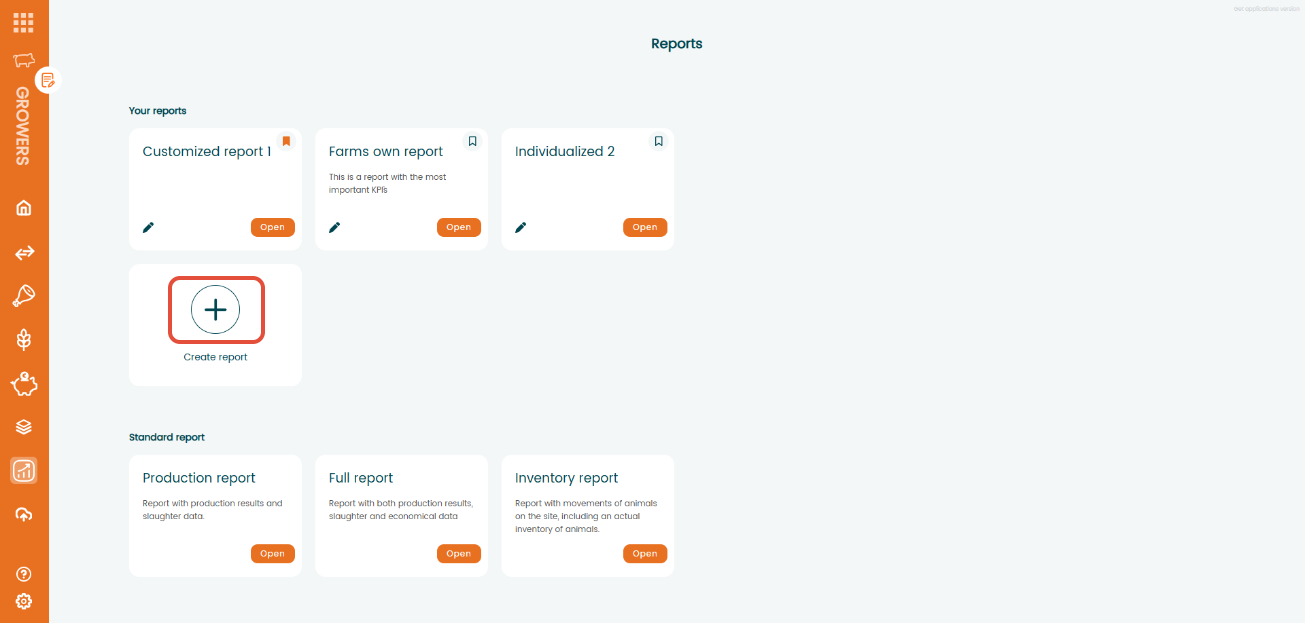
In the "Report" menu you find two different report categories:
- "Your reports": you can create your own reports with customized and advanced filtering as we explain later in this article
- "Standard reports": already configured reports by AgroVision
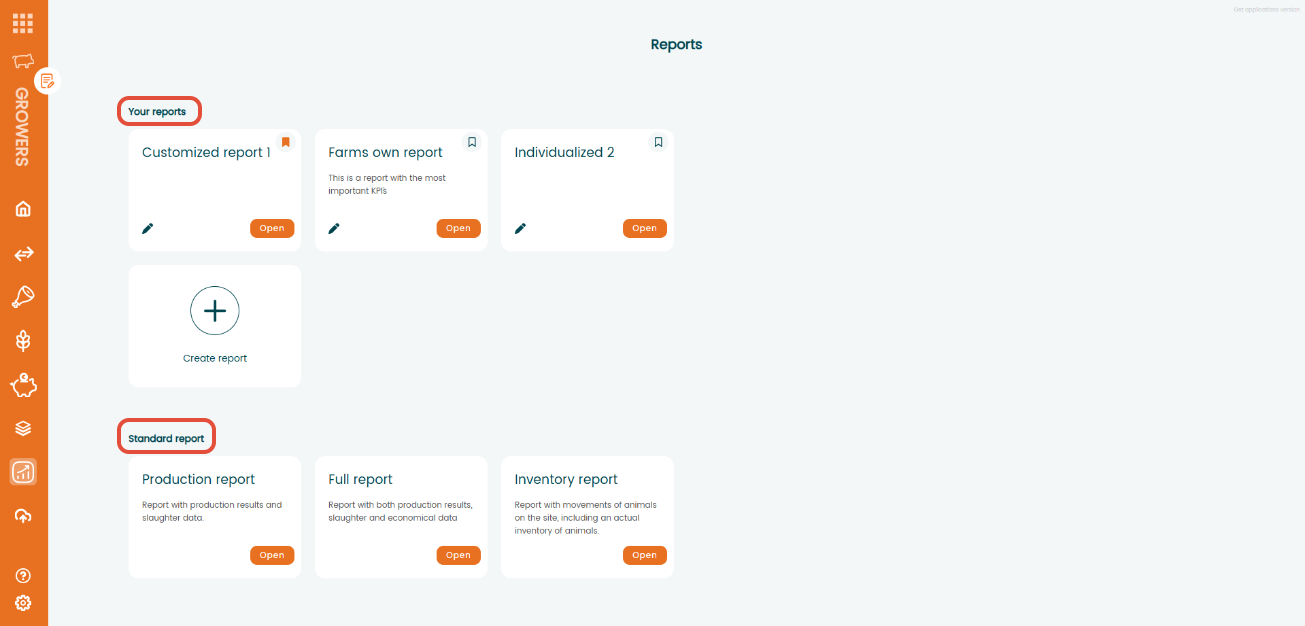
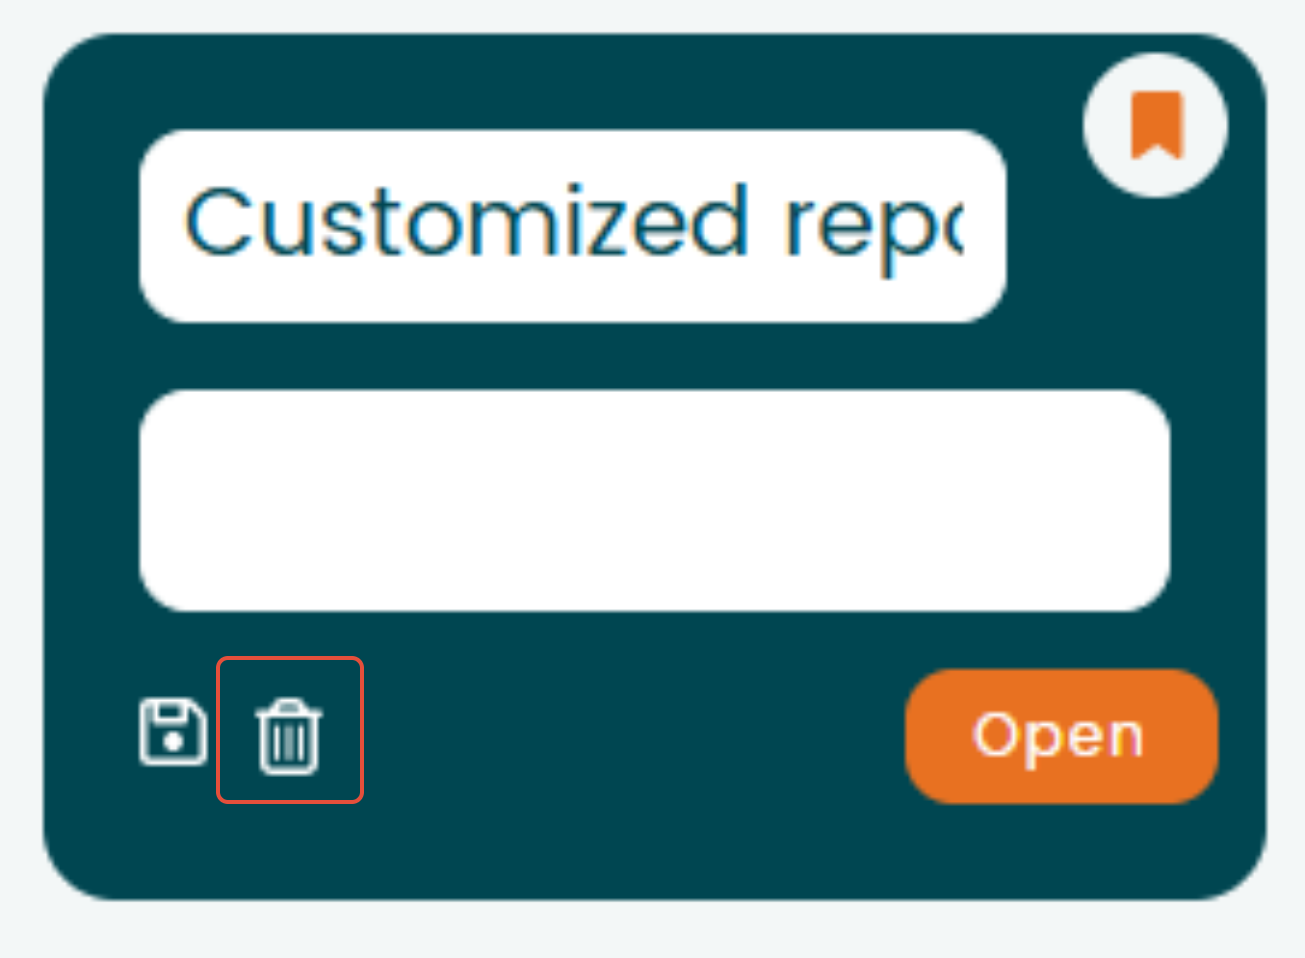
Inside "Your reports" you can rename them by clicking the pen icon in the bottom left corner of each report box.
When clicking that icon you'll be able to rename it by typing the new name and these changes will be saved if you click the save button.

You can discard the changes by clicking outside of the box and not clicking the save button and it will revert to the original.
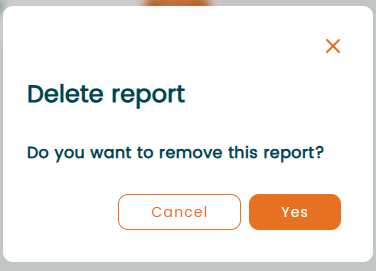
If you wan to delete a report, you need to click the edit button and then click the trash icon. A pop up window will be opened asking to confirm if you want to delete that report, when clicking "Yes" it will be deleted.
For creating a new report, click in the "+" icon above the "Create report" text. A new tab will be opened for setting up the new report.
You can select up to 4 different sites and batch/locations to include in the report. Clicking in each column you'll add the site and batch or location you want to be shown in the report.
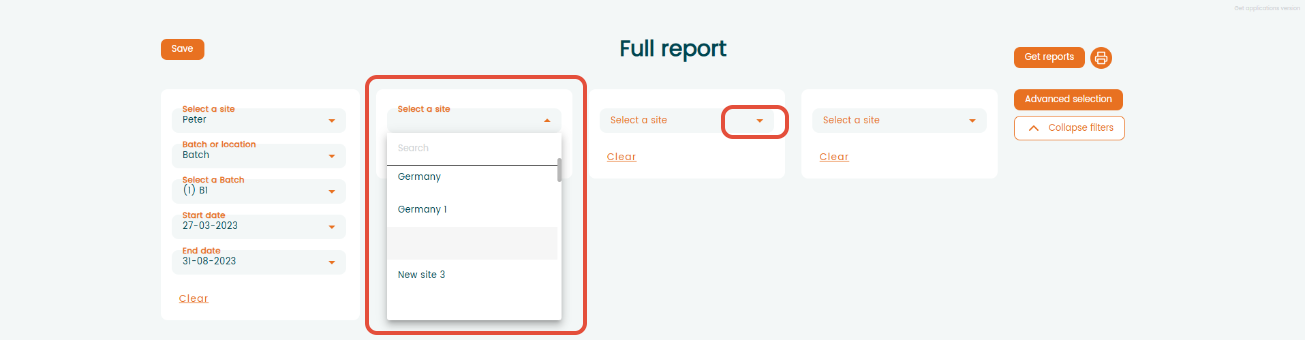
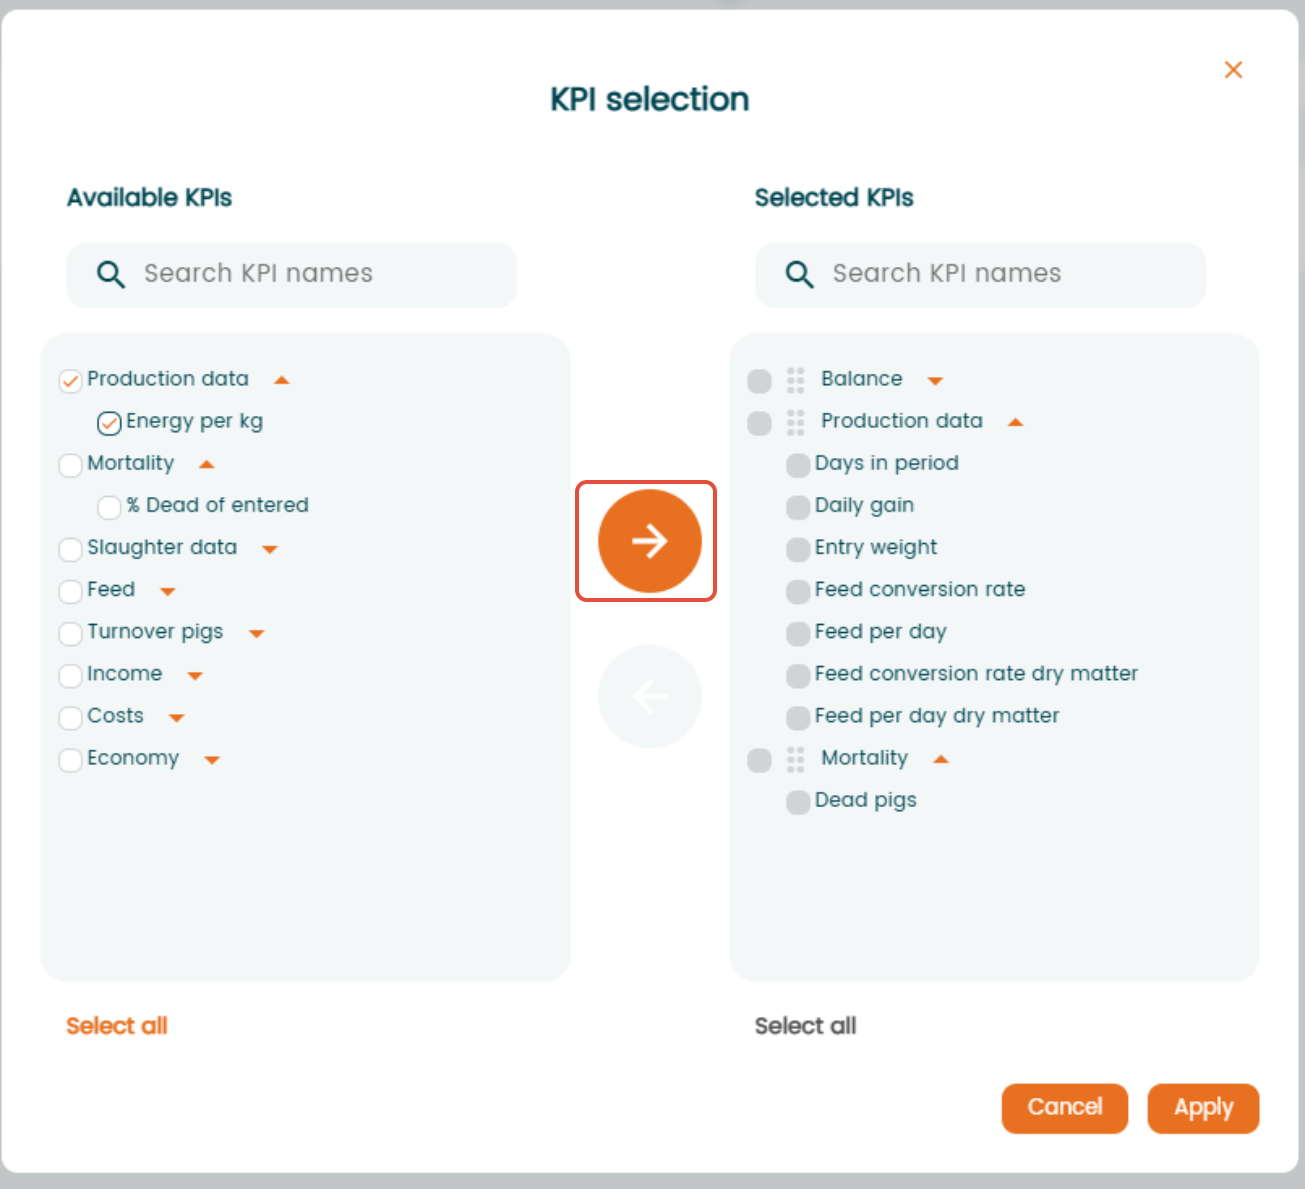
After selecting the sites you can click on the "Advanced selection" button to enable or disable different filters. Once clicked, a new window will open. There you'll see the available KPIs in the right column. Out of all KPIs available you can enable them to appear in the report just by adding a tick to the boxes alongside them.
When a KPI is selected a check mark will appear. You will find main categories and inside each category specific KPIs. If you mark a category all the specific KPIs inside that category will automatically be marked. If you want to select a specific KPI individually you can expand the menu and enable or disable each KPI one by one.
You can click the "Select all" button in the bottom to select all of them.

Once you have selected all the KPIs you want to use. you need to click on the right-pointing arrow icon to enable them. When enabled they will appear in the right column of "Selected KPIs".
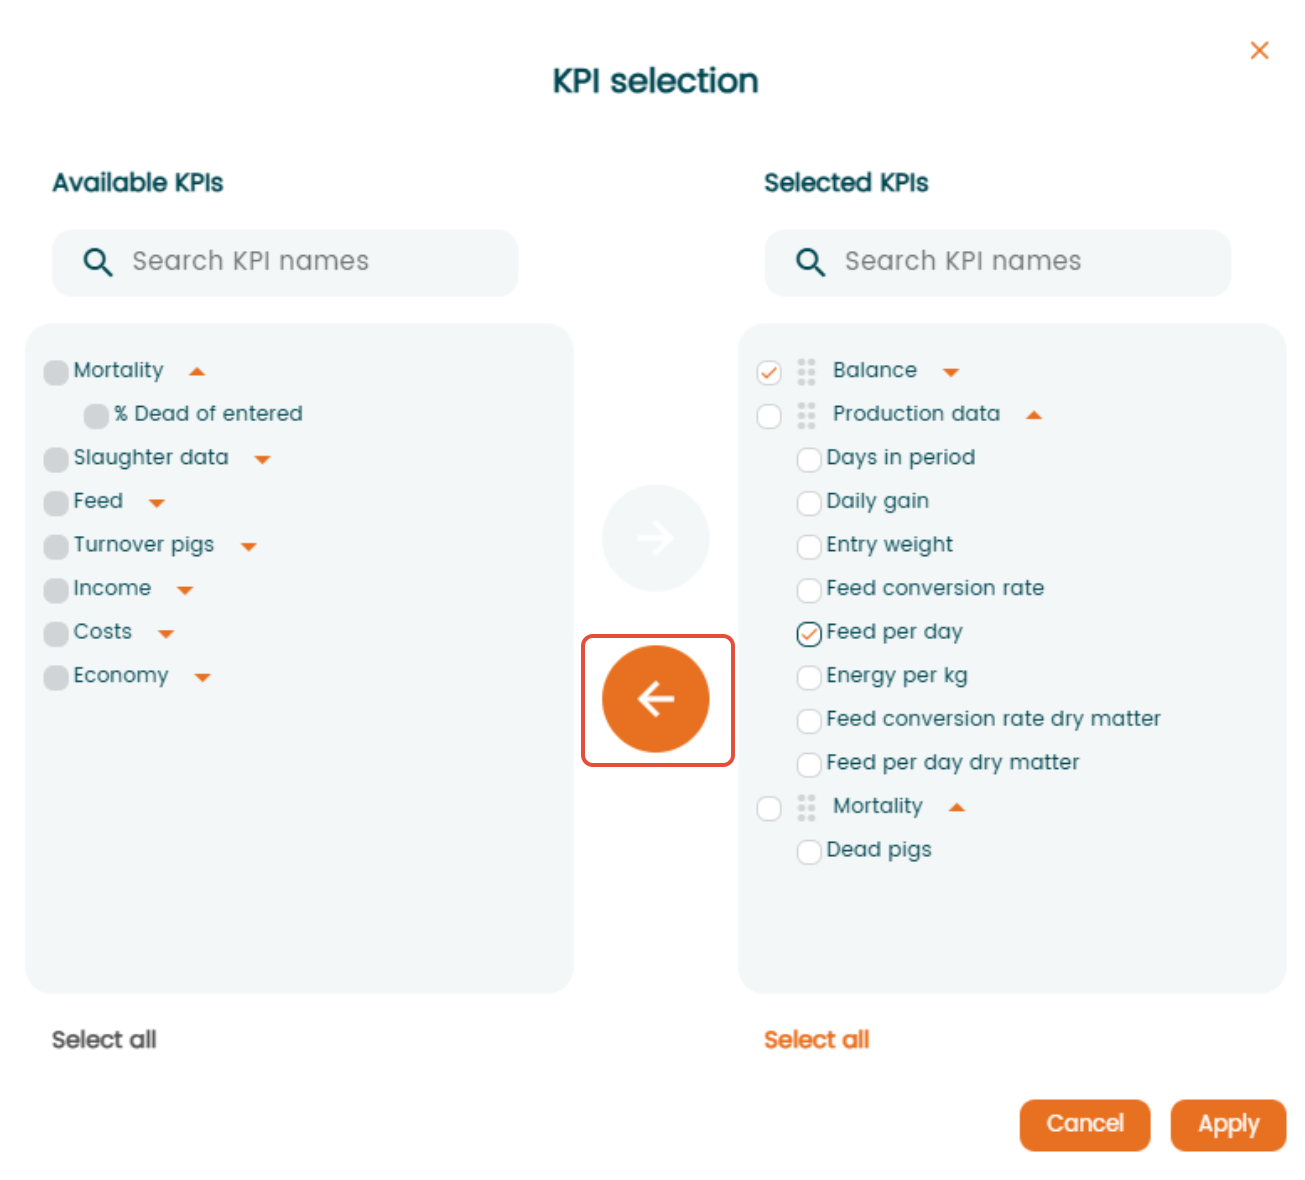
If you want to disable any of the selected KPIs you can repeat the same process but now you need to mark them in the right column of "Selected KPIs" and move them by clicking the left-pointing arrow to disable them.
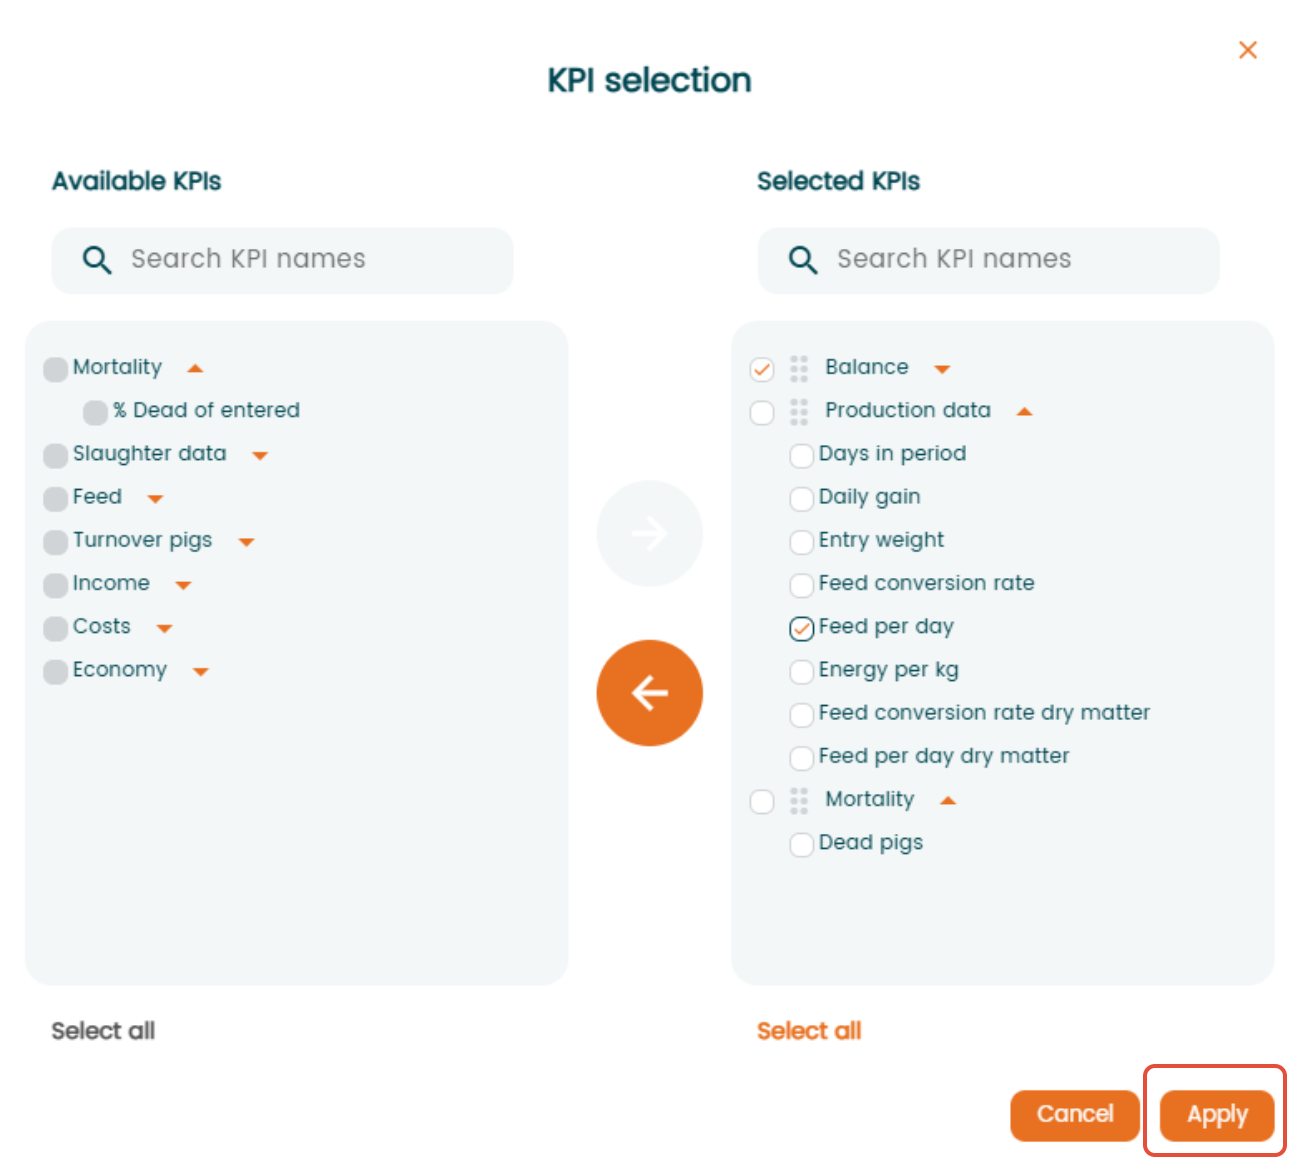
When you have finished setting the filters you have to click "Apply" in the bottom right corner to save them.
Now your customized report is available and visible with all the selected filters. Last thing you need to do is to save it by clicking the "Save" button.
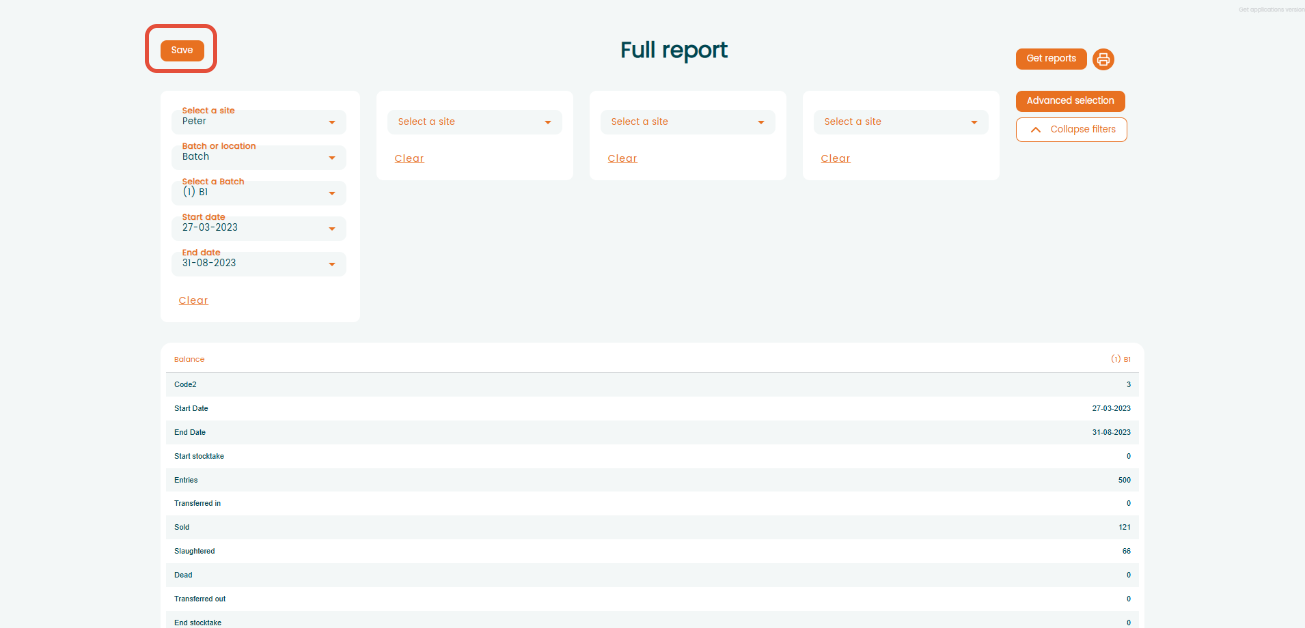
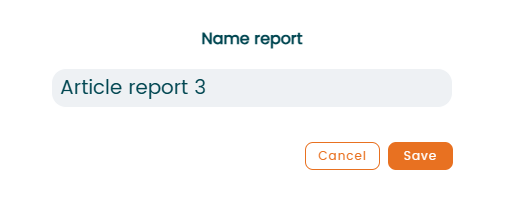
Then you need to set a name for the report by typing and click "Save".
Now your report is available and saved under "Your reports" and you can access it just by clicking Open.
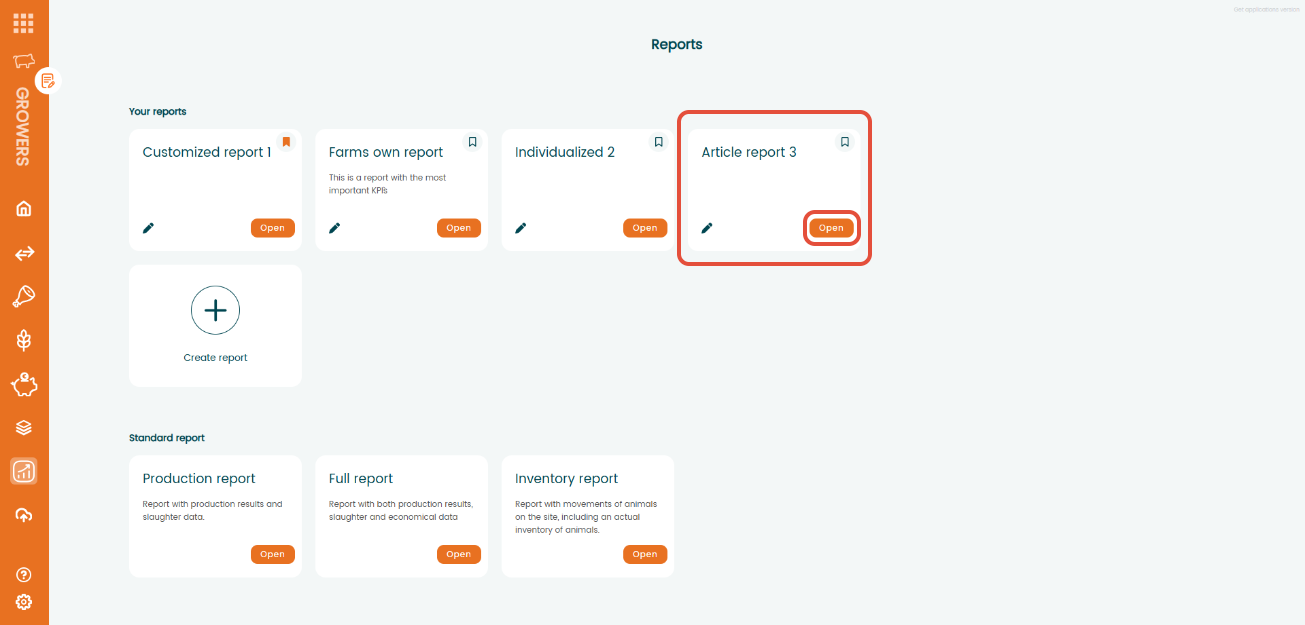
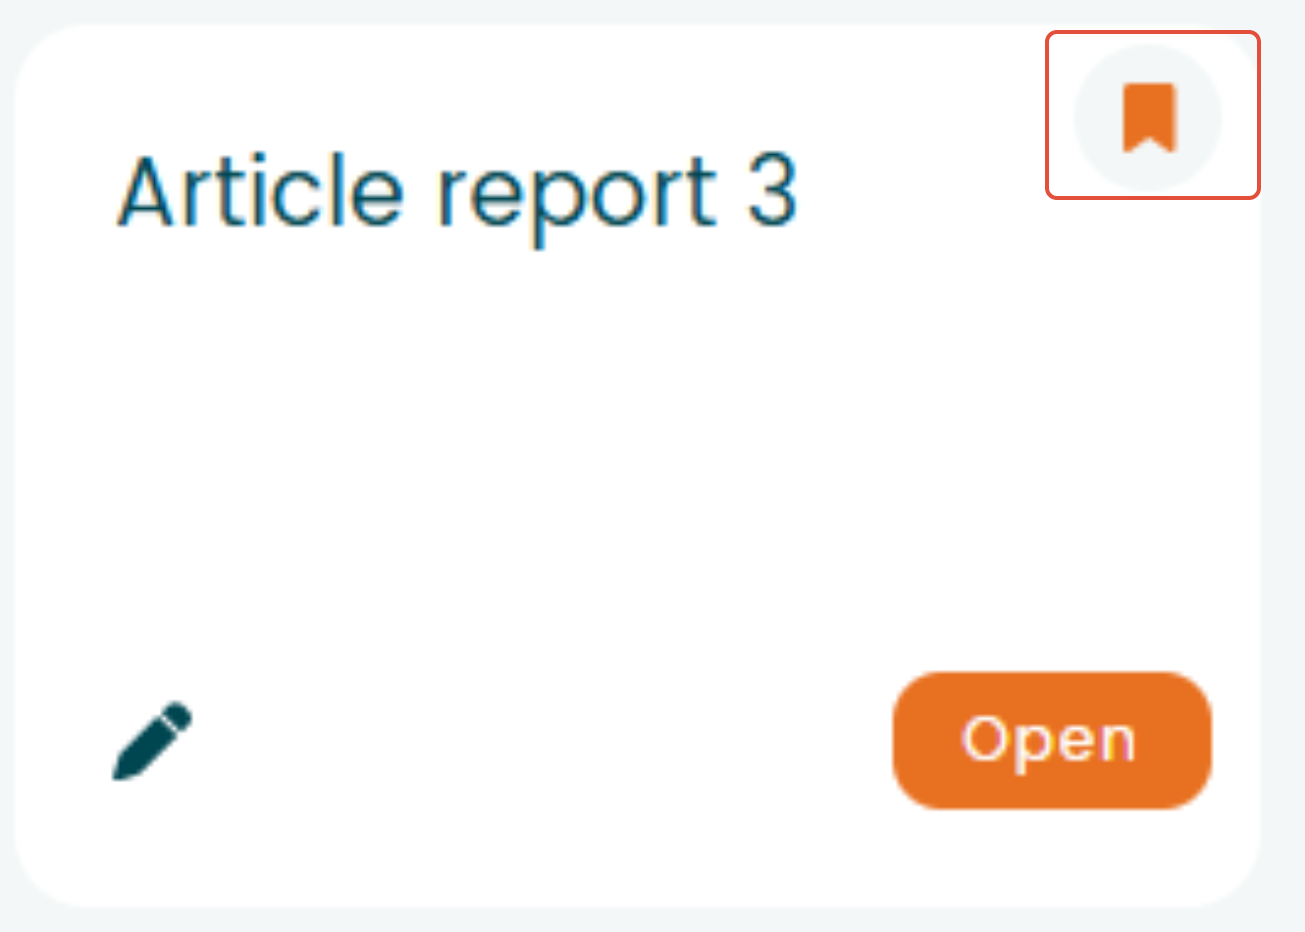
If you want a specific report to appear in first position in "My Reports" you just need to mark the bookmark icon in the top right corner and it will automatically be placed in first position.