"Home" dashboard is the first screen that appears when opening the app. If you are in a different menu you can open it in the menu bar located in the left side of the screen.

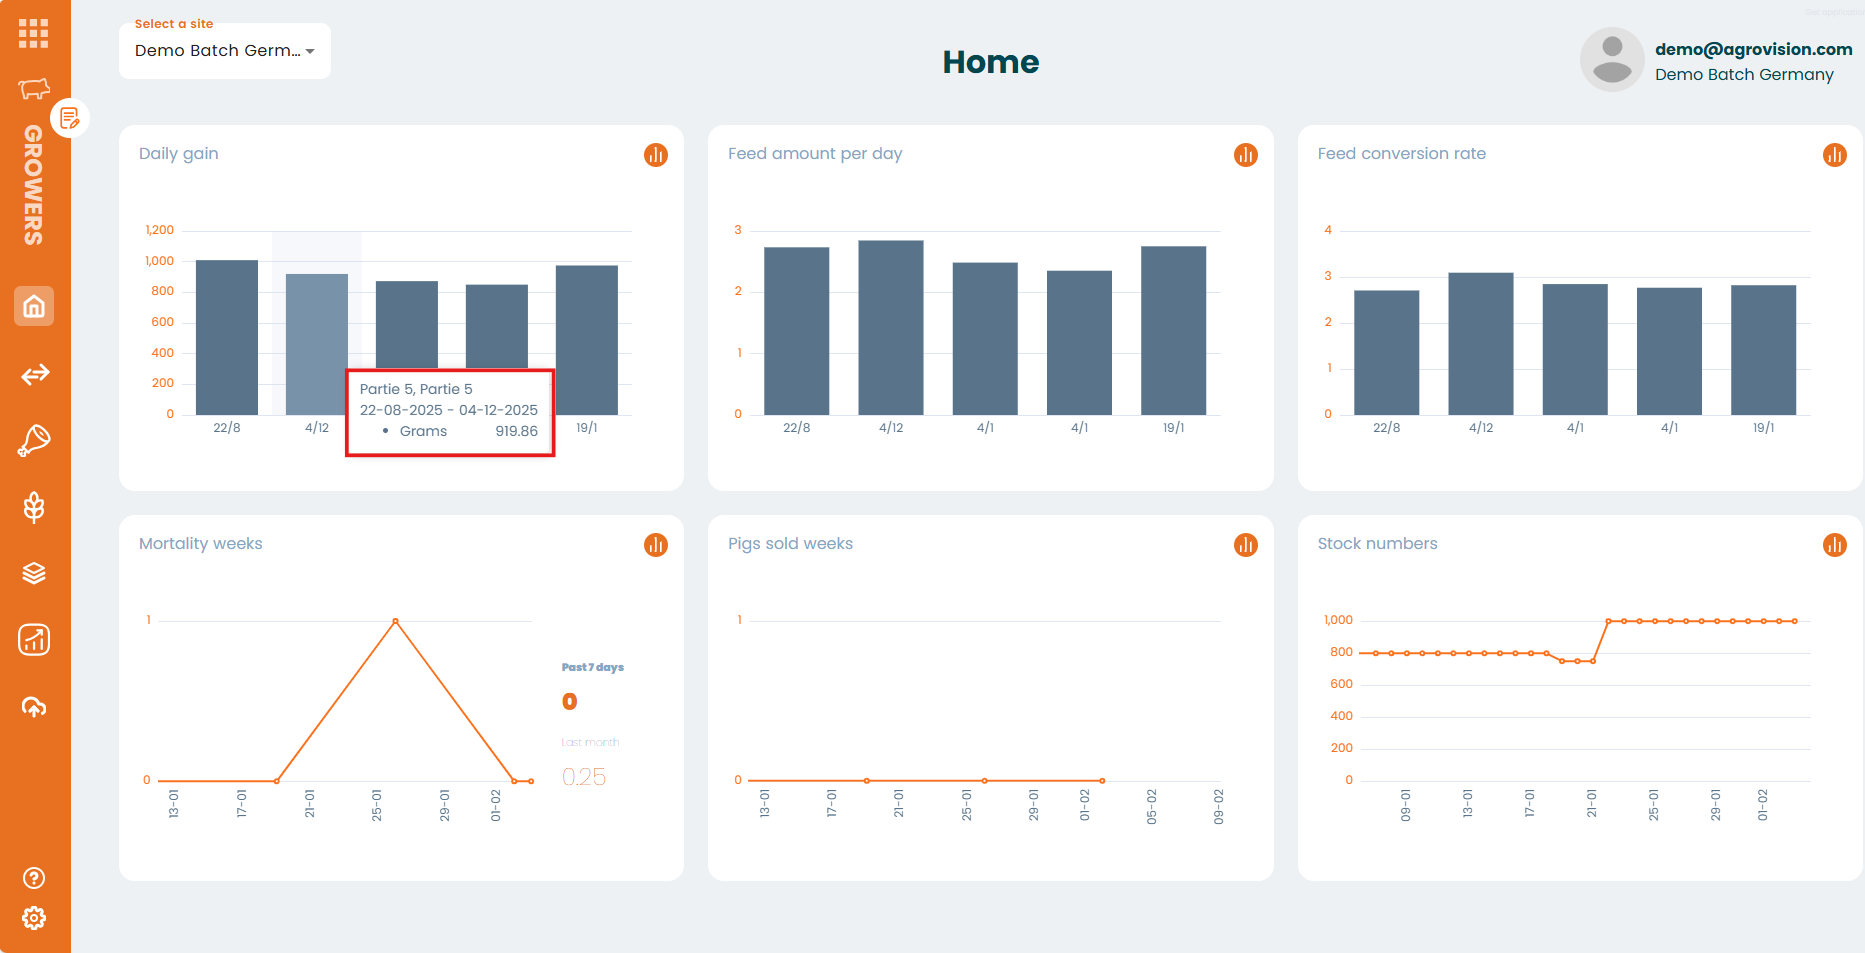
You will see different graphs with the main info of your site. The graphs are interactive and you can open them individually. If you place your mouse over a figure more information will appear.
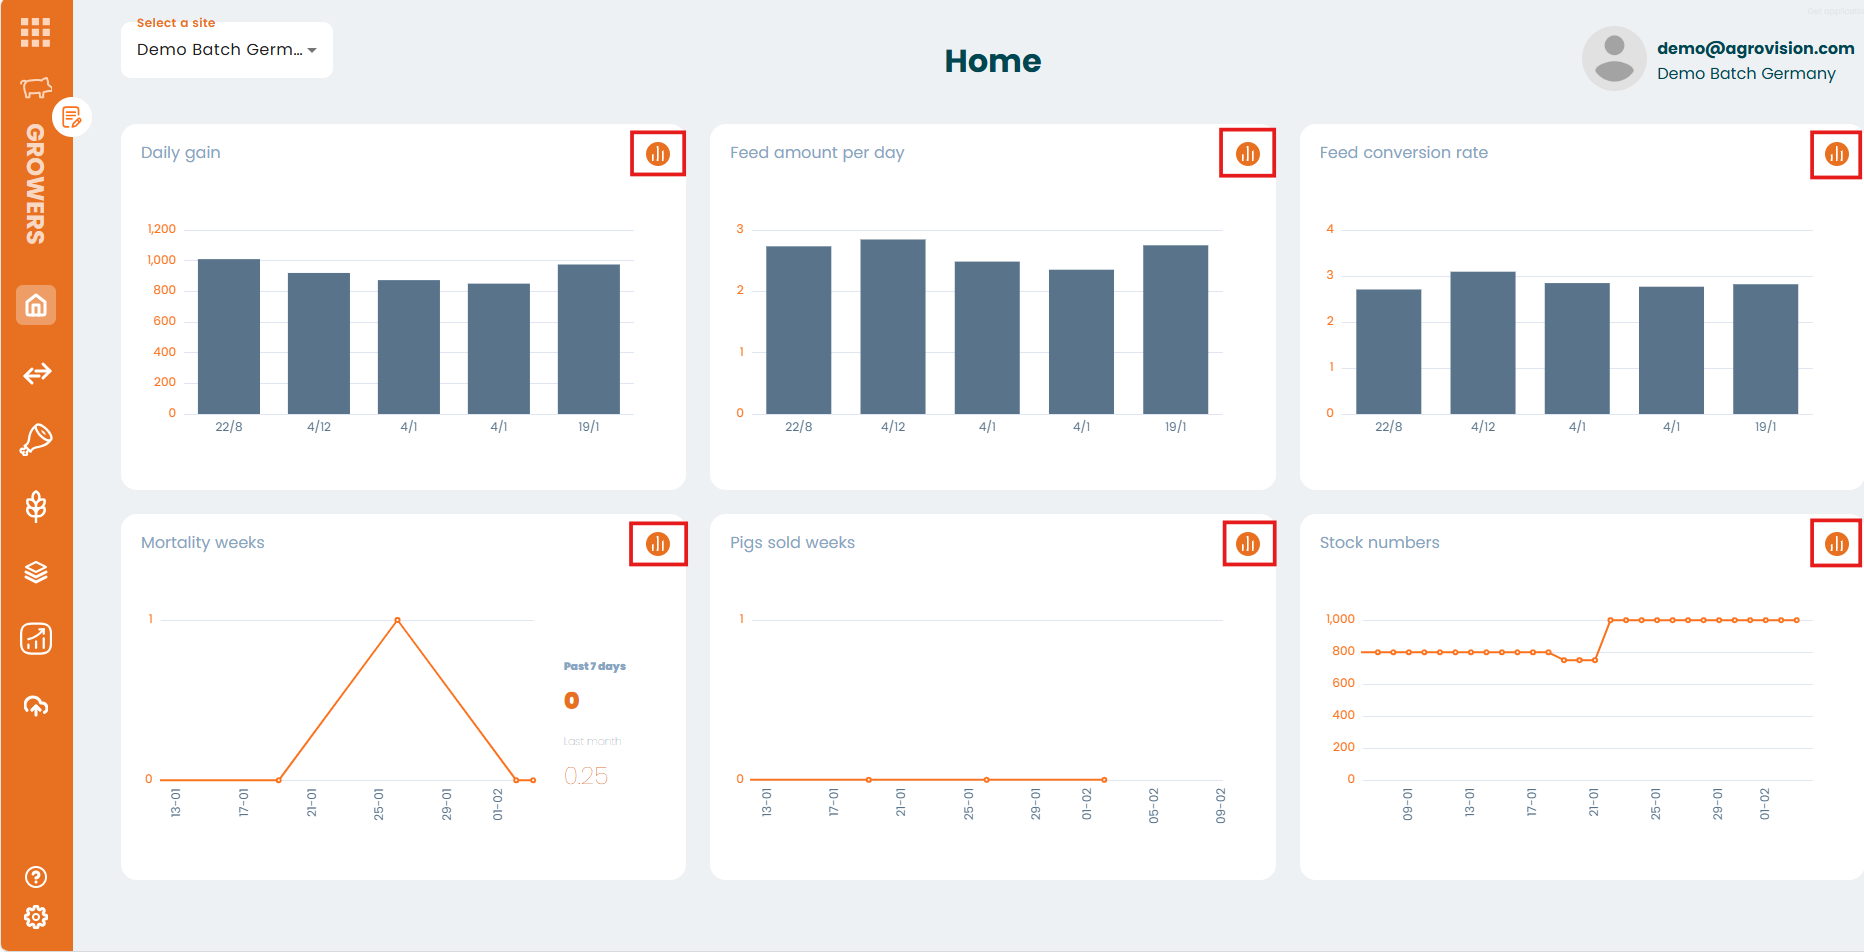
You can open a graph clicking in the orange button located in the top right corner above each one.
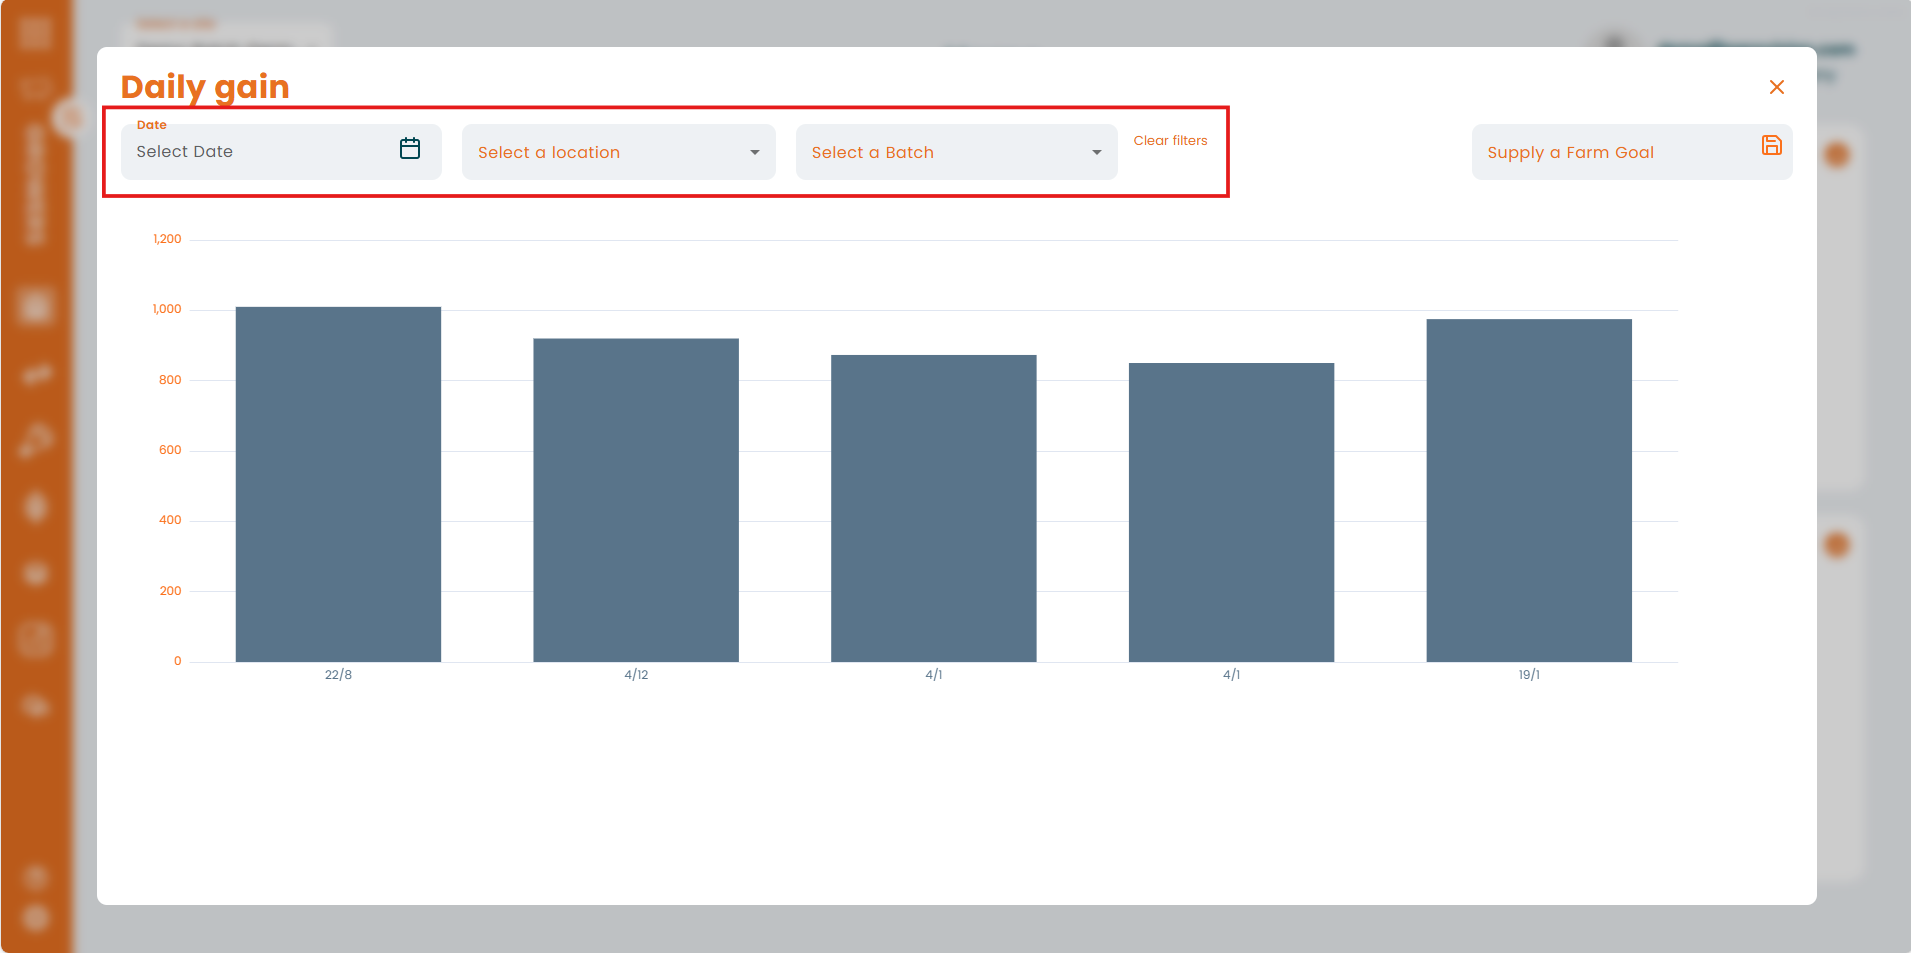
There you will see more details. You can apply filters and sort with the filter bar.
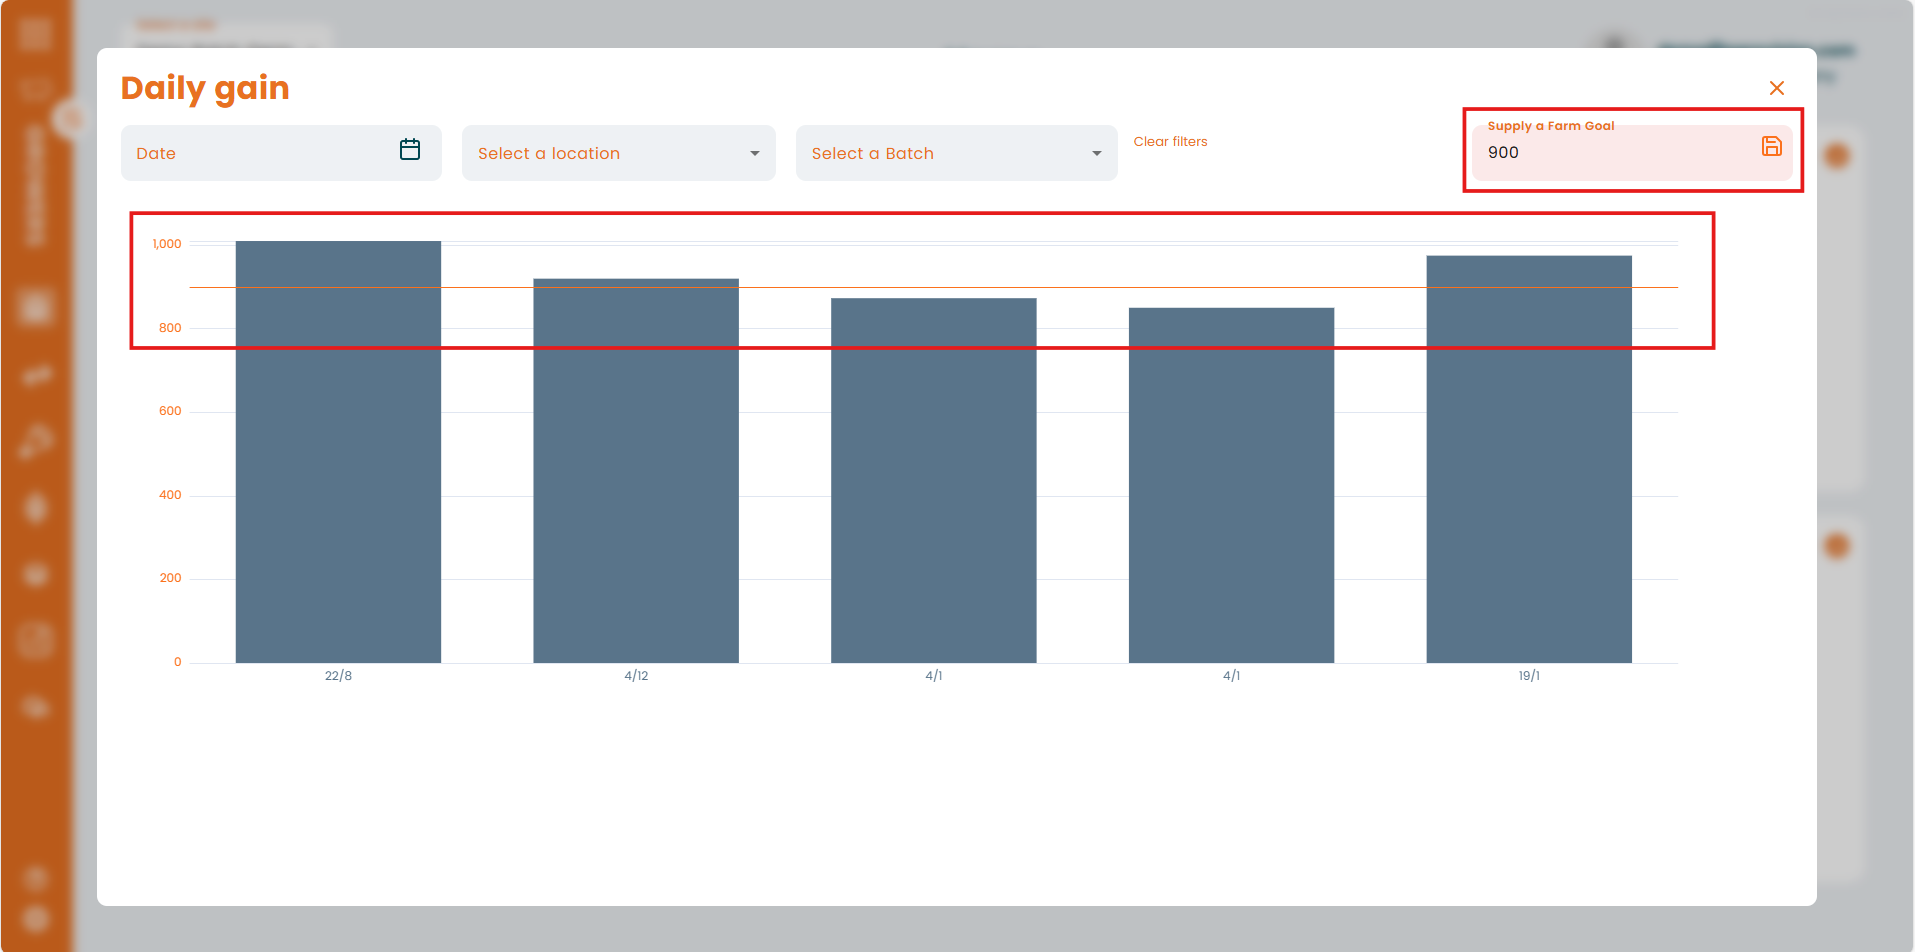
Finally, you can set a farm goal or target. This is an objective that will be shown in your graph so you can easily check if your data is above the goal or not. To change it just click, type your new goal and click in the save button. You will see the goal in the graph as an orange line.